How to forecast monthly and daily trends on New York Stock Exchange?
The most reliable method for forecasting monthly trends on the New York Stock Exchange for any desired month in advance is to take the planetary positions at the lunation of the previous month and
place these planetary positions in their right positions on the Chart of the New York Stock Exchange. A copy of this Chart, which was originated by the writer after a long period of economic research, accompanies this chapter.
The best way to learn how to forecast the Stock Market's trend in advance is to take an "example month" and work it out.
After doing a number of charts for months in advance and then watching the reaction of the Stock Market as it actually takes place, anyone can soon learn to get a quick off-hand knowledge of what to expect in the Stock Market.
The value of this method lies in the fact that it tells you at any time in advance WHAT month the Stock Market is apt to have a sharp drop or what month theStock Market is apt to be strongly bullish.
No other method used today by chart-readers offers such advantages.
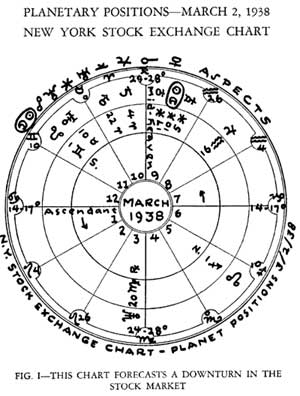
For an "example month," when a lower trend for stocks was clearly pointed out, let us take the month of March, 1938. The entire month was marked by a drop in the various stock market averages and many stocks dropped to 1932 lows.
How was this fact pointed out?
New Moon or lunation occurs every twenty-eight days and that this lunation, by the angular relationship of the planets at the time of the New Moon, points out the trend of the New York Stock Market during the coming twenty-eight days.
The nearest lunation or New Moon, which precedes the month of March generally, occurred March 2, 1938. (As a rule the lunation affecting the coming month is given in the month before, which in this case would be February, 1938.
The Ephemeris, however, states that there was "no New Moon in February"; so the lunation of March 2, 1938 is used to give the indications for the month of March).
On March 2, 1938, at the time of the lunation, the positions of the planets were as follows: Sun 10 degrees Pisces; Moon 10 degrees Pisces; Neptune 20 degrees Virgo retrograde; Uranus 10 degrees Taurus; Saturn 4 degrees Aries; Jupiter 16 degrees Aquarius; Mars 22 degrees Aries; Venus 17 degrees Pisces; Mercury 5 degrees Pisces. The Moon's North Node, which defines the general curve of economic cycles, was in 1 degree Sagittarius. These planets placed around a skeleton New York Stock Exchange Chart pointed out, by their positions and angular relationships to each other, the unstable Stock Market condition of March, 1938.
It is necessary in this subject as well as in any other subject to use abbreviations and symbols whenever possible to conserve both time and energy. It is easy to place the signs with their degrees around the skeleton chart of the New York Stock Exchange whereas it is awkward and tedious to write the words and degrees out on the chart. From now on the abbreviations and "short-hand" symbols for the signs and planets as well as their angles will be used in this chapter and other parts of the book; therefore a brief table is given here for the reader to familiarize himself with and the more quickly these symbols are learned, the easier it will be to give a quick and accurate judgment of stock conditions at any time.
The Sun and Moon are not strictly planets in an astronomical sense, but in this work they are so labelled in order to simplify matters.
It also will be noticed that two planets have rulership over two signs each. This is due to the fact that there are only ten planets known.
Like the chemist, we use what we have, although we know at some time two planets will be discovered which rule Taurus and Gemini. However, every planet has a sign in which it is almost as strong as in the sign it rules; therefore,
it is all right to use Venus and Mercury as the rulers of Taurus and Gemini until research in astronomy gives us the two missing planets.
It is also necessary to know a few elementary facts regarding the Chart of the New York Stock Exchange. These facts apply to all charts, and they should be learned carefully.
Each chart has twelve sections, one for each sign of the zodiac. The signs placed on these twelve cusps or spokes are arranged counter-clockwise, and so are the planets. Each sign has 30 degrees in it and the degree which falls on the cusp tells where a planet is to be placed on the chart. For instance, on the example chart for March the Sun and Moon fell in 10 degrees Pisces. Since this degree falls before 24-28 degrees Pisces (which is the sign on the tenth cusp, the Sun and Moon fall in the 9th section of the chart instead of the 10th section or "house." The planet Uranus, on this chart, fell in 10 degrees Taurus and since zero degrees Taurus falls on the 11th section of the chart, Uranus actually falls in the 11th section or "house." (The twelve sections of a chart are called "houses".)
It sometimes happens that a sign will be intercepted in a "house", making two signs with their corresponding planetary rulers, governors of that particular section. This is due to the fact that charts set up for different latitudes "cut" the zodiac into different sized sections.
Most charts will have degrees and minutes on the cusp of the 1st house or ascendant, but it will be noticed that the Chart of the New York Stock Exchange has the connotation "14-17 degrees Cancer " on the first house or ascendant and the notation 24-28 degrees Pisces on the tenth house or mid-heaven
of the same Chart. Do not let this confuse you. It merely means that these degrees have been found to include a sensitive area in connection with stock market trends whenever subject to planetary transits.
Those who read the Louise McWhirter's «Astrology and stock market forecasting» book are interested if the technique described in chapter 3 may be implemented in AE
Trader of AE Financial. The answer is YES, and here a step-by-step guide.
Step 1
- Switch the program to *Wheel mode.
- Go to Preferences/ Calculation/Houses and check if the Placidus system selected. Most mundane and financial astrologers use it.
- Go to Preferences/Wheel and set the Bi-wheel chart aspects to Second chart and check the First chart houses only box.
Step 2
- Go to Main Menu/Edit Entries
- Add the new chart for May 17 1792, 12:48 GMT, 40°45' (North) and -74°00' (West).
You may instantly check if your input is correct by watching the Sun/Moon/Asc position in preview beneath the place name.
Step 3
Add the NYSE birth chart to work list
Step 4
Add a new chart for New Moon of
March 2, 1938 5:40 GMT, and add it to the list of charts your are working with
Step 5
Add a bi-wheel chart by checking the boxes for NYSE.
When you exit from Chart Manager to Main Screen you will see the chart like below.
Those customers who own the version above 1.4.xx can find the mentioned entries in sample database AstroElite shipped with. They may skip many steps. It's similar to original on the page 104 of mentioned book.